When display came along 20 years ago, it was a bit of a shock for traditional TV. Its world was video – and suddenly they had to compete with the display. Today’s connected TV and OTT solutions offer a huge opportunity for broadcasters, or anyone involved in video, production, distribution, and transmission. With these optimistic words, Nielsen’s Matt O’Grady began his keynote at the TV On the Move conference.
Measurement is essential
Nielsen is in the measurement business and provides, among other things, unique insights into what viewers are watching in defined market areas. Broadcasters need to understand how viewers perceive television, as it is critical to reaching the right people at the right time with the right content. This requires reliable measurement solutions to get an accurate picture of what viewers are watching – when, where, how often, and on what platform.
“Our promise and commitment to the market is that we will be able to measure all professional content, both content and ads, on any device or distribution platform.”
Matt O’Grady
As part of his speech, Grady presented the results of The Media Landscape (2019) total audience report, which focuses on three key points – viewers, Nielsen solutions and One Media Truth – and provides a huge amount of statistical data.
Portrait of a changing consumer
The first piece of data that Nielsen looked at was the average amount of time U.S. consumers spend consuming different media daily.
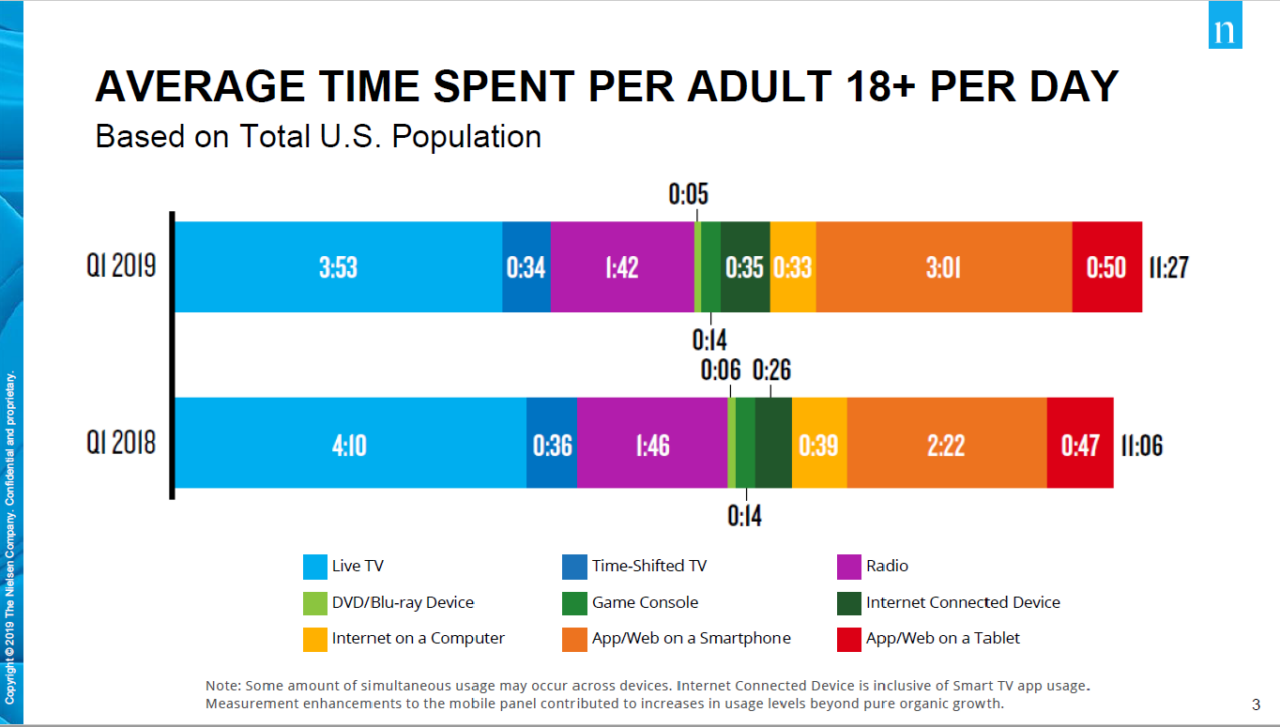
As seen in the chart above, Nielsen compared the first quarter of 2019 to the first quarter of 2018 as part of the report. Daily time spent watching live TV decreased from 4 hours and 10 minutes in 2018 to 3 hours and 53 minutes in 2019. Time-shifted TV also decreased – from 36 to 34 minutes.
It is interesting to note that total daily consumption actually increased – from 11 hours and 6 minutes to 11 hours and 27 minutes. It is due to the use of apps/websites on smartphones, which saw a dramatic increase of 40 minutes over the year, placing it in a notional second place in the media rankings – behind live TV, which took the top spot in both years. Another device that saw a rise is the internet-connected device. It is marked with a green bar in the figure.
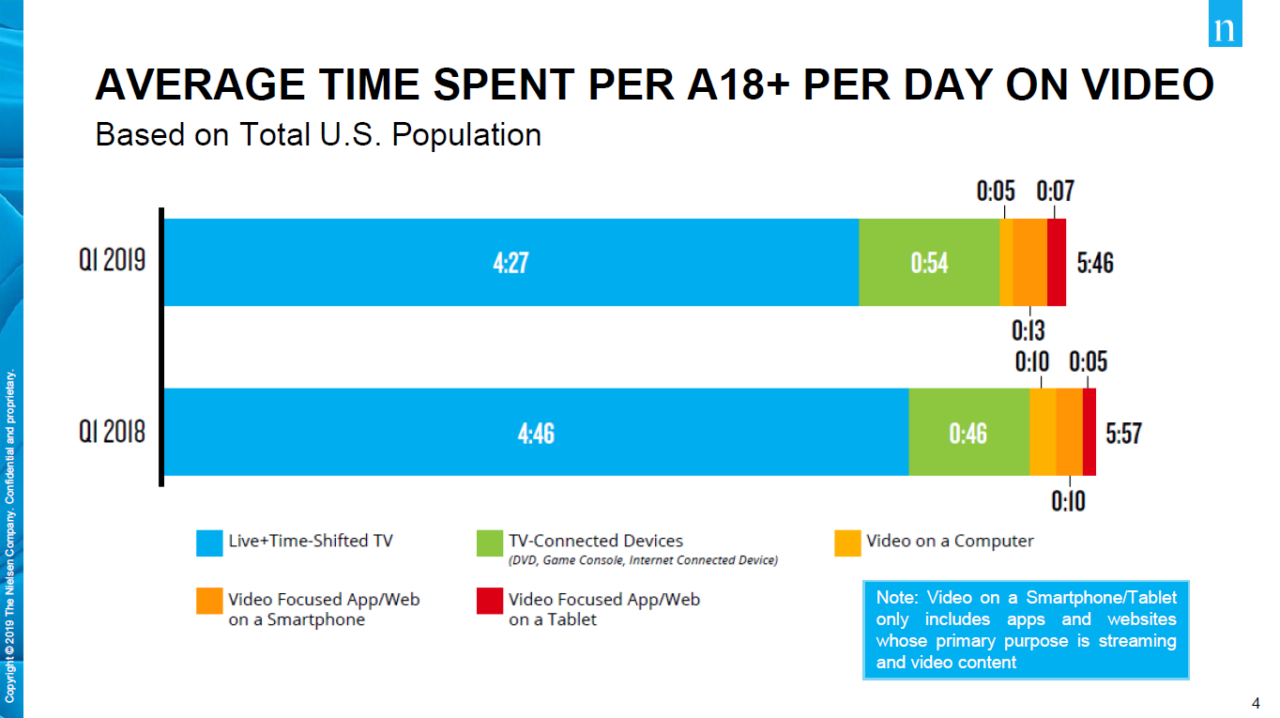
However, when we restrict the data to video only, we can see that the drop in video has increased from 4 hours and 46 minutes to 4 hours and 27 minutes (a difference of 19 minutes). In contrast, devices connected to the TV saw an increase of 8 minutes.
Content search
Another of the interesting questions that the total audience report focused on was how people search for content and how much time they spent searching for it.
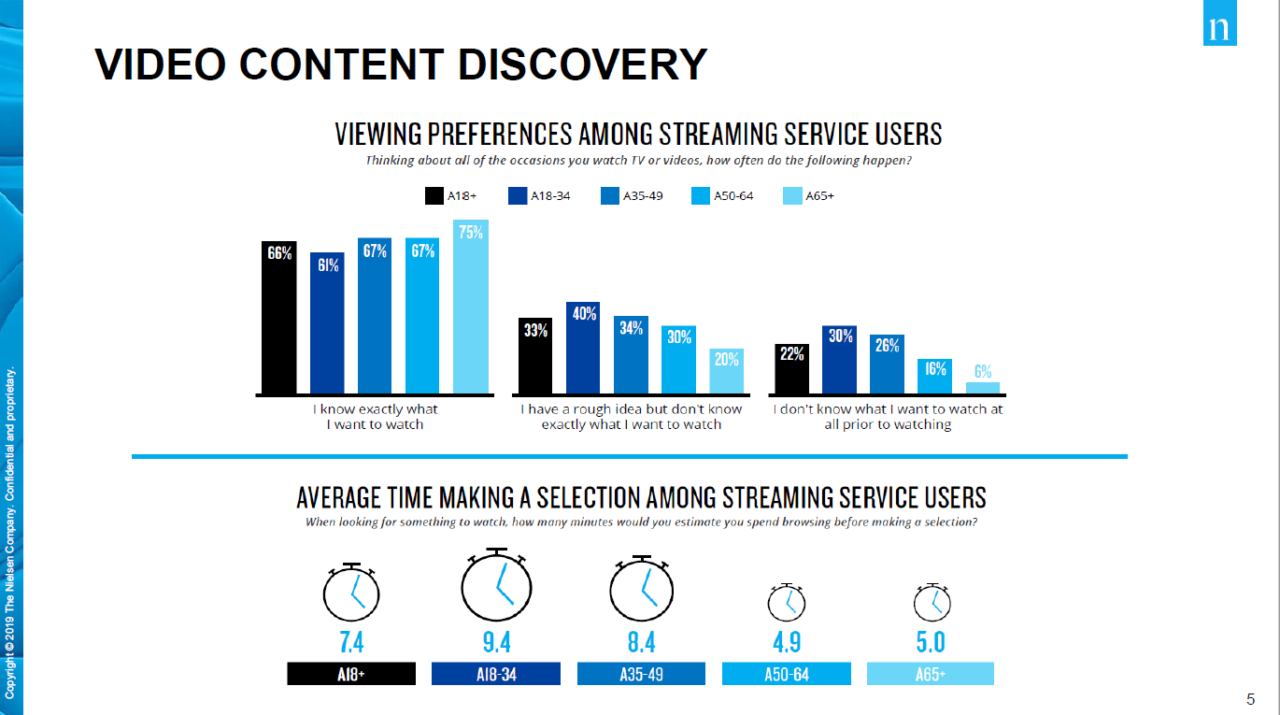
Individuals falling into the 65+ age category are the fastest at selecting content. It takes them less than 5 minutes to figure out what they want to watch. In the 50-64 age category, it is 4.9 minutes. People aged 18-34 and 35-49 spend the most time browsing and selecting options.
When it comes to how much individuals know what they want to watch, viewers over 65 are very clear. By contrast, consumers aged 18-34 are the least certain. They chose ‘I have a rough idea but I don’t know exactly what I want to watch’ in 40% and ‘I have no idea what I want to watch at all’ in 30%.
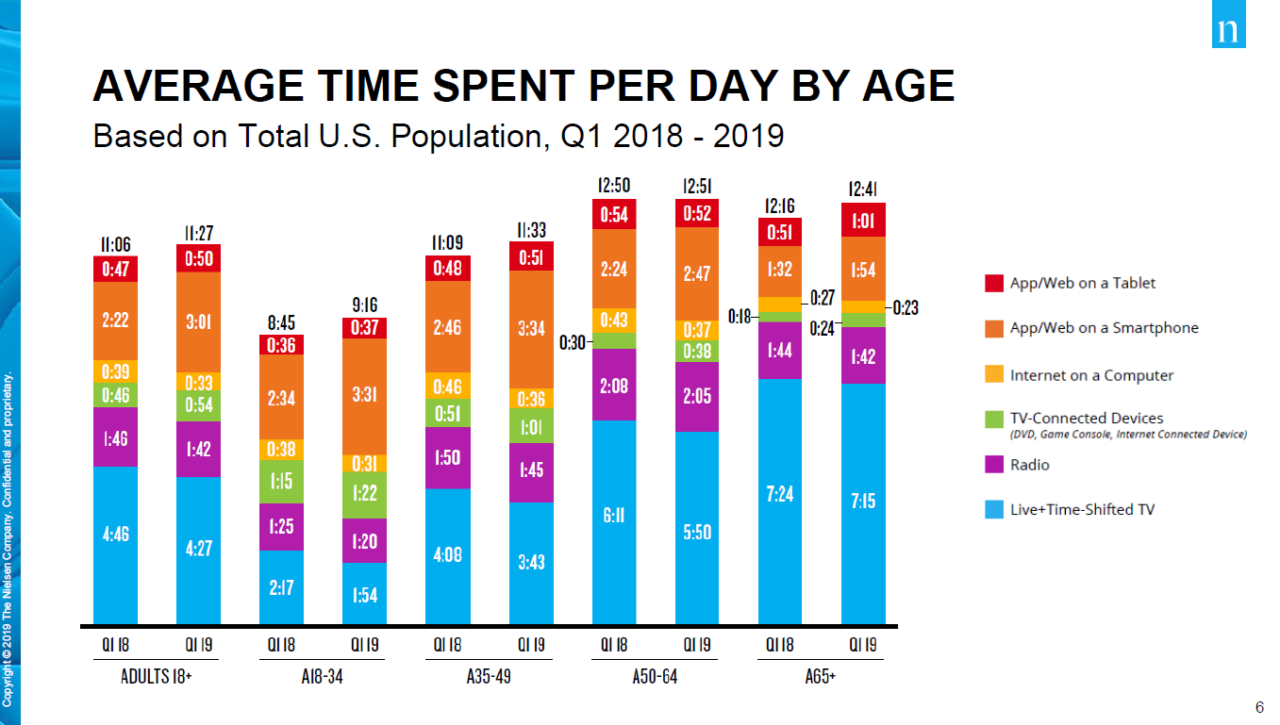
Average time spent watching different media per day by age
The Q1 2018 and Q1 2019 figures were compared in the five age categories of the US population. The results show that 18–34-year-olds watch the least TV. Their live or time-shifted TV viewing time decreased from 2 hours and 17 minutes to 1 hour and 54 minutes over the year, a significant decrease of 23 minutes. However, there is a marked increase in their viewing of apps/websites on a smartphone. This increase amounts to almost an hour!
Older viewers still watch a lot of live and time-shifted TV, but their use of apps/websites on a smartphone has also increased. For those aged 50-64, the increase is 23 minutes, and for individuals aged 65+, it is 22 minutes. Moreover, the chart shows that even older audiences are now comfortable with a tablet, they can stream, connect to OTT, etc.
Use of various devices in the household
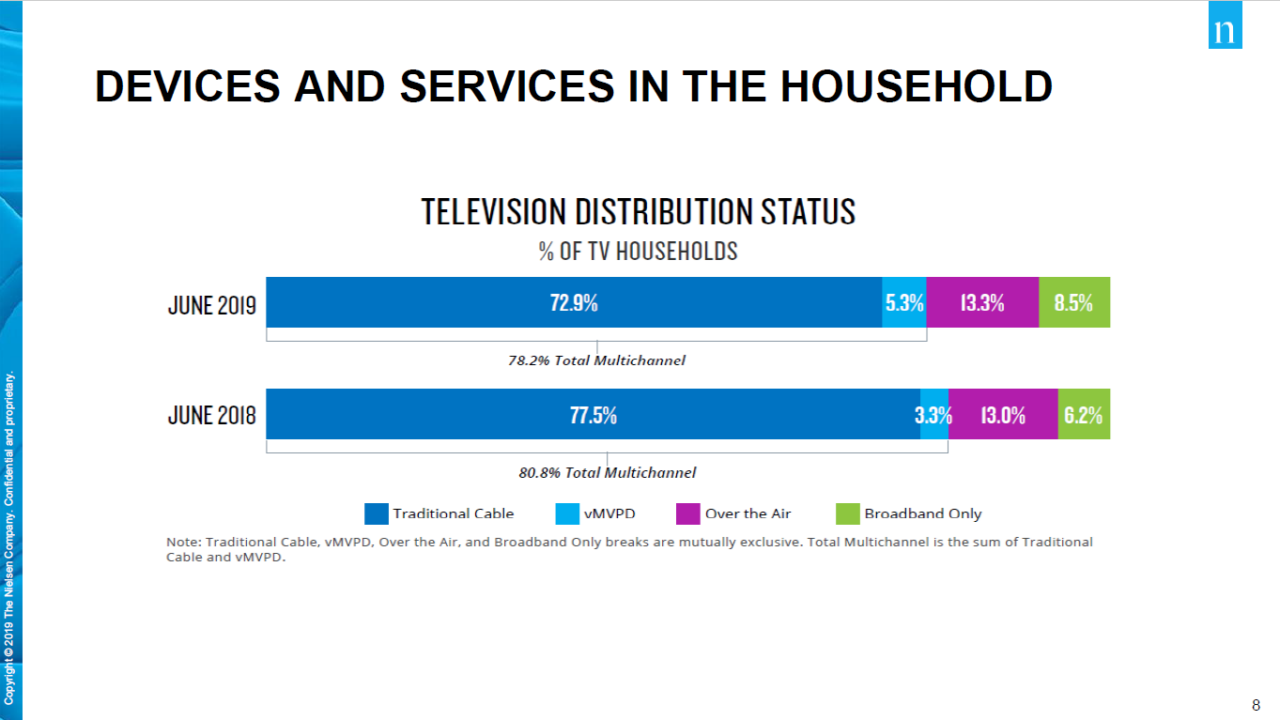
The types of devices in the household and a way to access professional or TV content were also examined. Traditional cable TV is the most commonly used device in American households, although its representation declined in 2019 (72.9%) compared to 2018 (77.5%). Over-the-air (OTA) wireless distribution is in second place by a huge margin.
Monetisation is important
According to Grady, marketers and agencies are constantly looking for ways to ensure they get a fair share, can monetise their content, and continue to invest in content. And in doing so, they are constantly unsure whether they have reliable metrics to allocate their spend.
“I start a campaign. I launch it on four or five platforms, four or five networks, and broadcast stations, and then my agency comes back to me with three or four different metrics to tally up, to trust. There’s a bit of a crisis of confidence around some of these metrics. We’ve made too much of a mess of it.”
Matt O’Grady
We need to find a single metric across media ensuring everyone within the industry is working with one currency that is stable, trusted and fast. What are the main requirements of agencies and marketers?
- Stability: stabilisation of TV panels – reduction of standard error, data variability.
- Coverage: increasing digital coverage – measurement of players in streaming services, increased bargaining power.
- Metrics: standardised metrics – independent measurement of purchasing power.
- Innovation: investing in innovation – the ability to flexibly adapt to a changing market.
According to the total audience report, 23% of the audience is not captured and monetised. Nielsen proposes to address the problem with its international Nano People Meter solution, which is also designed for Europe.
 State-of-the-art technology from Nielsen
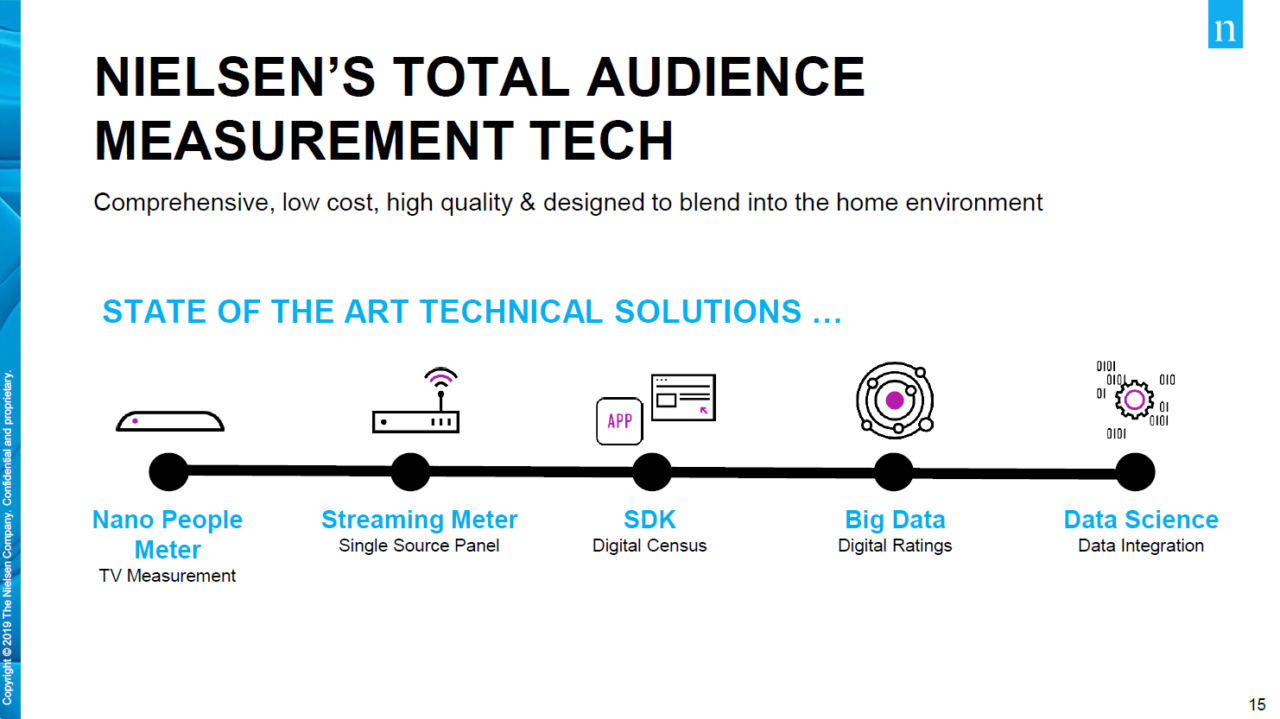
The Nano People Meter requires people to log in when watching TV in the same household. In addition, a streaming meter is also being introduced. Households will thus have two meters – a Nano People Meter connected to the TV and a streaming meter that will register every device in the household.
Every tablet, every connected device, and every smartphone will be registered with the streaming meter and it will be absolutely clear what is being streamed in the household. Of course, the metering will also work outside the household when consumers take their devices outside. Compared to the historic People Meter, the Nano People Meter, which Nielsen has been developing for 10 years, is smaller and easier to connect to the Internet.
According to Grady, measuring total viewership across TV and Digital can bring in more revenue:
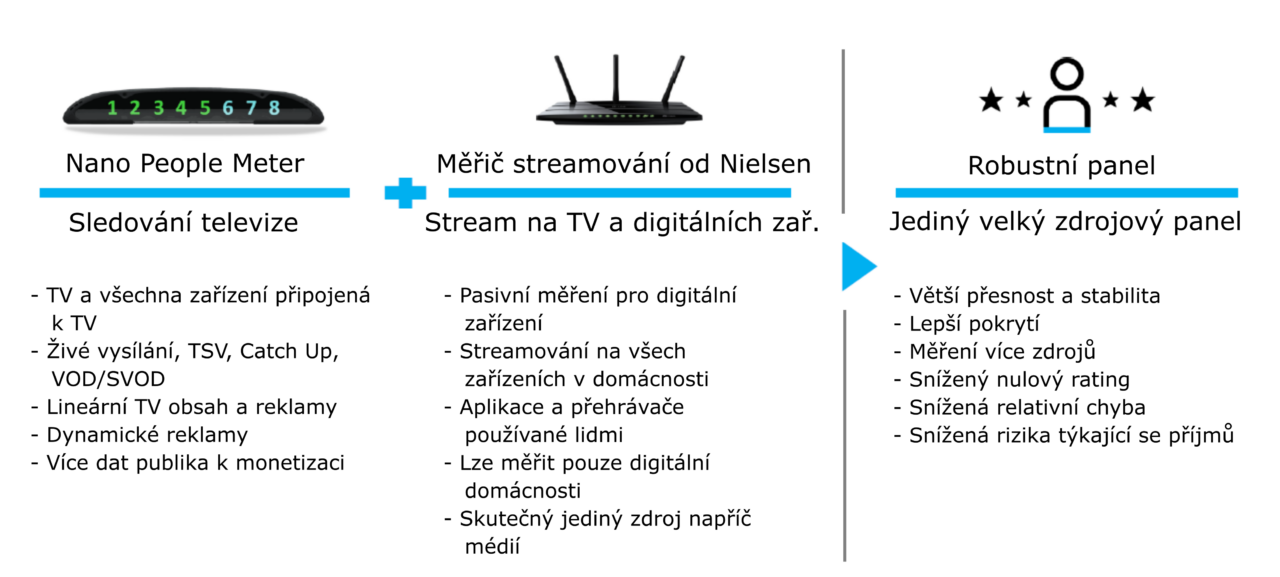
Figure description:
Nano People Meter: Watching TV
- TV and all devices connected to TV
- Live TV, TSV, Catch Up, VOD/SVOD
- Linear TV content and advertising
- Dynamic advertising
- More audience data on monetisation
Nielsen Streaming Meter: Streaming on TV and digital devices
- Passive measurement for digital devices
- Streaming on all devices in the household
- Applications and players used by people
- Only digital households can be measured
- A real single source across media
Robust Panel: A single big source panel
- More accuracy and stability
- Better coverage
- Multiple source measurement
- Reduced zero rating
- Reduced relative error
- Reduced risks of income
Other Nielsen projects Grady mentioned in his speech include Nielsen Gracenote Team for automatic content recognition and Nielsen Advanced Vide Advertising for addressable advertising.
Addressable advertising
Addressable technology is a big and booming business, according to Grady. In the U.S., linear addressable TV saw growth to $3.3 billion in 2020 (up from $2.5 billion in 2019). In the UK, more than 17,000 addressable campaigns have been launched across more than 100 channels and 1,800 brands. In Germany, broadcasters RTL and ProSiebetnSat.1 launched overlay ads using the HbbTV standard in millions of German households.
In Europe, the use of a combination of HbbTV, STB, and addressable ACR is planned. The HbbTV standard has been integrated into most modern smart TVs.
“The future of smart TV measurement must take into account addressable advertising.”
Matt O’Grady
Grady mentioned that the Czech Republic is very advanced in using HbbTV technology for addressable TV advertising, especially overlay ads. Nielsen’s ACR-based addressable platform can help Czech broadcasters increase their addressable reach by enabling addressable advertising on non-HbbTV devices (or where HbbTV is blocked).
Overall media usage is increasing
The next chart relates to the total media usage and weekly time spent consuming media based on the total population. The chart compares the share of each media on viewing in 2003, 2008, 2013, and 2018.
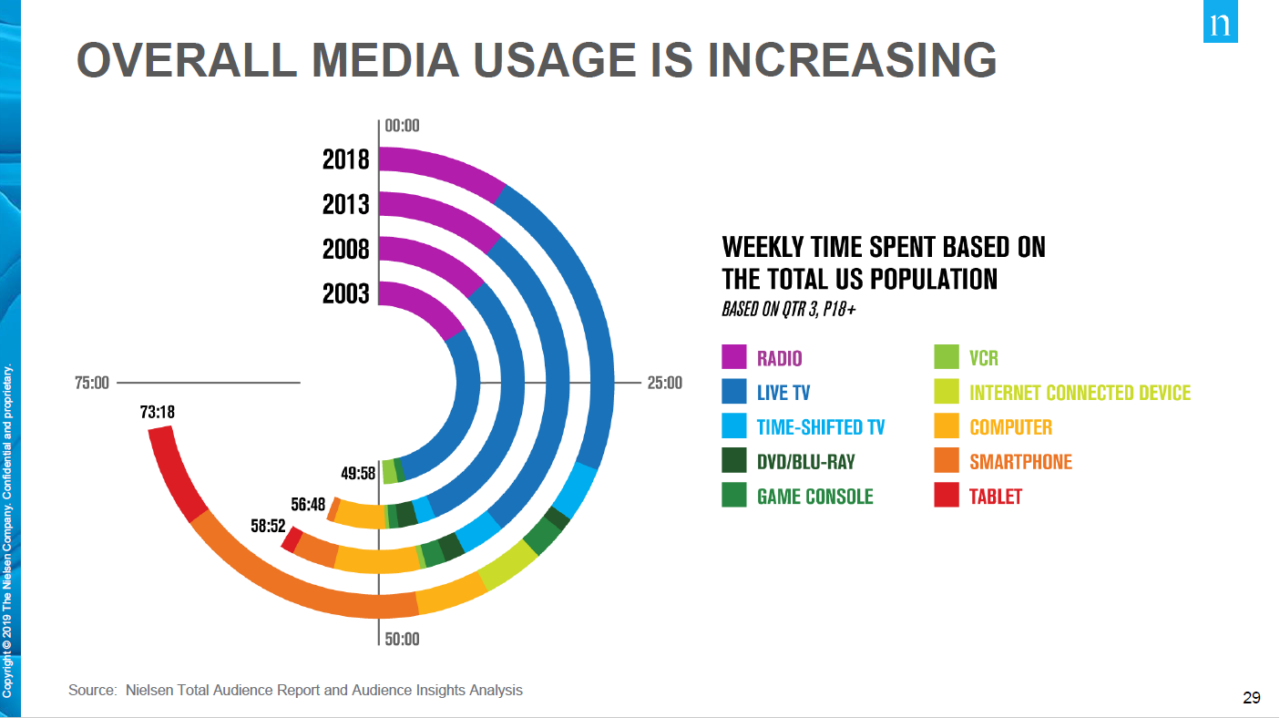
In 2018, smartphones and tablets saw the highest increase in usage, as did gaming consoles, and internet-connected devices. Television’s share of viewing was roughly the same in 2018 as in 2013.
Conclusion: a single metric is the key
At the end of the lecture, Grady addressed a big opportunity for the media, which requires a change. He said that the market penetration of campaigns was hampered by the existence of multiple metrics. “The gross rating point or impression should be defined the same whether it is digital or non-digital, whether it is social or non-social, whether it is search or non-search. But our commitment to everyone is to ensure that all vendors use the same metrics. Otherwise, it’s just a huge, chaotic landscape,” explains Matt O’Grady.
One of the metrics Nielsen wants to provide to prospects is the total audience. “We also understand the business aspects and how important it is to have something consistent, comparable and stable. Something you can audit and trust. That’s why we want to achieve alignment across digital and other areas in terms of comparability. It needs to be a ubiquitous measurement where everyone can see everything. That does not exist now, and it will be hard to achieve. We need the support of the ecosystem, we need the support of everyone in this room to make this a reality,” O’Grady concluded his talk.
Who is Matt O’Grady
Matt O’Grady is the Chief Commercial Officer of Nielsen’s global media business and oversees all countries outside the United States. He is responsible for all revenue, clients and services for the 56 countries in which Nielsen operates today. Prior to returning to Nielsen, Grady was CEO of Nielsen Catalina Solutions (NCS), a joint venture between Nielsen and Catalina Marketing. At NCS, he was responsible for the overall management and leadership of this rapidly growing company. Before that, Grady held several positions at Nielsen. He was Executive Vice President and Managing Director of the U.S. Local Media business, where he managed strategy, development and enhancements for all local TV and audio clients. He was also the global head of Nielsen’s first multi-platform product and strategy team, where he was responsible for all multi-platform audience measurement solutions including TV, mobile and web.

