For the ninth year in a row, RTR Medien and TELETEST analysed video usage in Austria as part of their annual moving image study. 99 per cent of all Austrian residents use video content several times a week, and almost three quarters (74 per cent) even daily. The daily viewing time for the total population is 223 minutes (3 hours 43 minutes), which is above the pre-pandemic level. People aged 14 to 49 also spend about the same amount of time watching video content as before the pandemic, i.e. 186 minutes (3 hours 6 minutes).
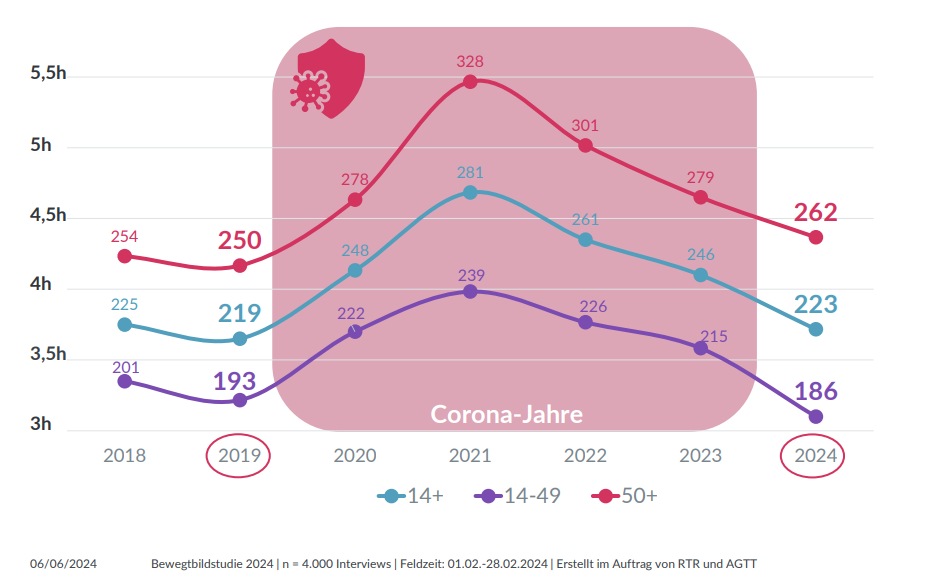
“For the third consecutive year, moving image consumption has shown a very consistent picture. Content consumption of broadcasters is consistently at a very high level with 77%. A slight decline in linear live TV usage is offset by time-shifted viewing of broadcaster content. Some video and streaming portals are experiencing a slight decline or stagnation in a highly fragmented and competitive market. A picture is emerging of a coexistence of TV content and online alternatives in which both sides could find their place,”
says Wolfgang Struber, Managing Director of RTR Medien, analysing the situation.
“The intensive use of quality broadcaster content in all age groups underlines the importance of an established and trusted media brand for viewers and the advertising industry. Over the past year, all broadcast groups in the Austrian TV market – including JOYN, ORF ON, ServusTV On and RTL+ – have launched extensive digital transformation projects that offer a pioneering streaming experience,” emphasises Thomas Gruber (ProSiebenSat.1 PULS 4), Chairman of the TELETEST working group.
Stable usage behaviour
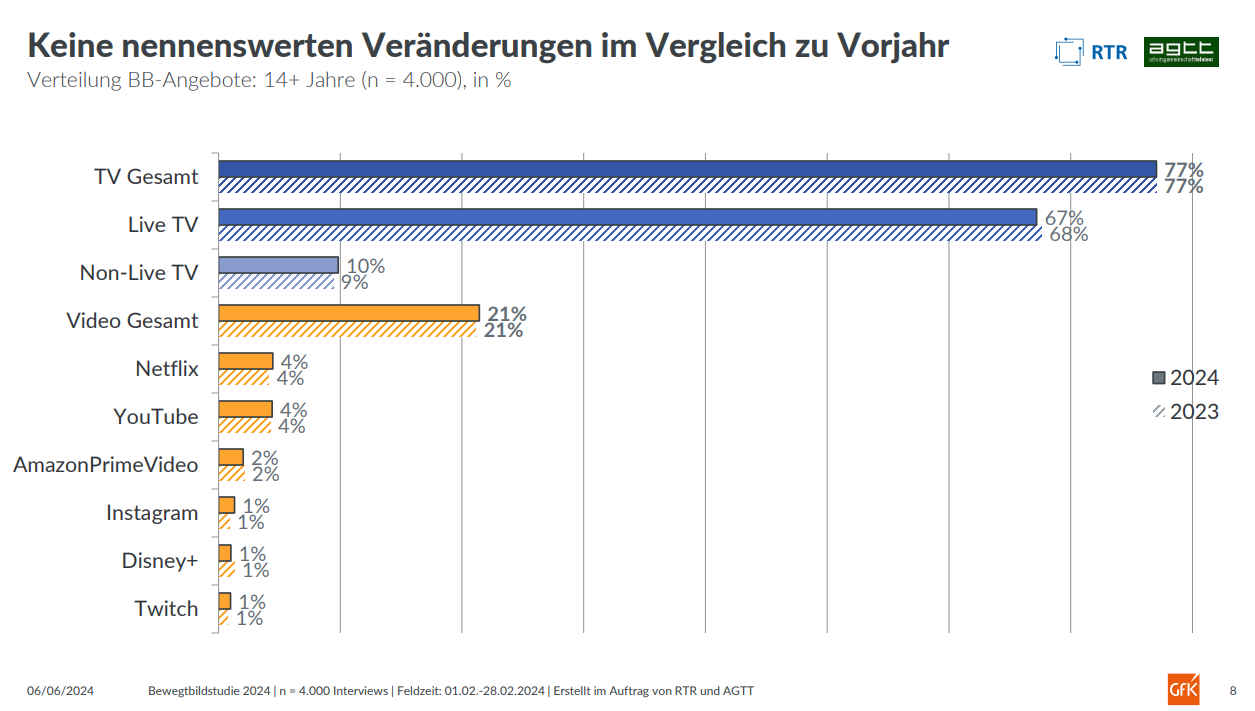
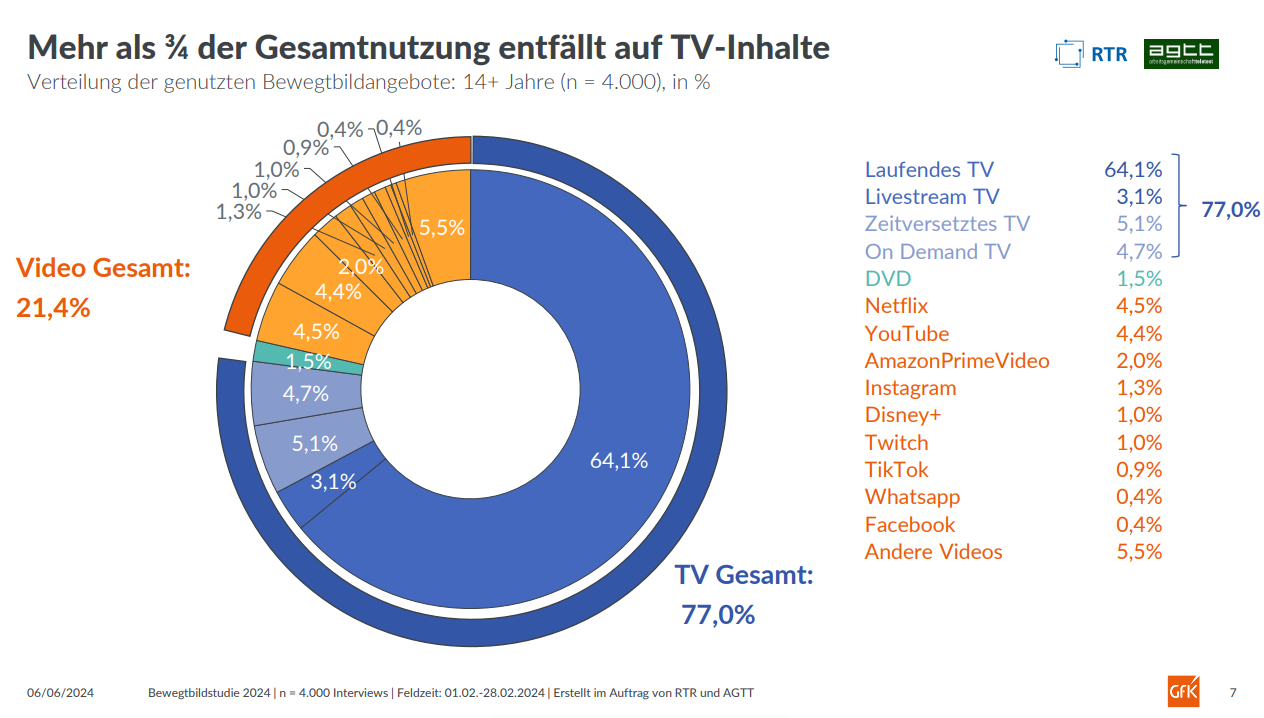
On average, almost eight out of ten minutes of moving image time (77%) is spent by one person per day with content from broadcasters. In the total population, 67% of moving image use is for live TV from broadcasters (traditional broadcasting or live streaming). Time-shifted viewing of broadcasters’ offerings has increased slightly from the previous year and stands at 10%. All other online video offerings (from Netflix to YouTube, Prime Video to Disney+, DAZN and videos on social media or illegal platforms) together account for 21%, the same level as the previous year. Netflix accounts for 4.5% of usage across the population, YouTube 4.4% and Prime Video 2%; all other providers are below this threshold.
In the 14-49 age group, broadcasters’ offerings account for 58% of total moving image usage. Live TV accounts for approximately 46%, and time-shifted viewing 12%. Among the predominantly global video providers, Netflix leads with 8.4% of usage time, followed by YouTube (8%) and Prime Video (3%) by a small margin.
 Among the young active user group aged 14-29, broadcasters’ offerings continue to be the most prominent across all distribution channels, accounting for 43% of daily video usage. Among alternative video offers, YouTube leads with 12% ahead of Netflix (11%).
Campfire effect in prime time: video consumption during the day
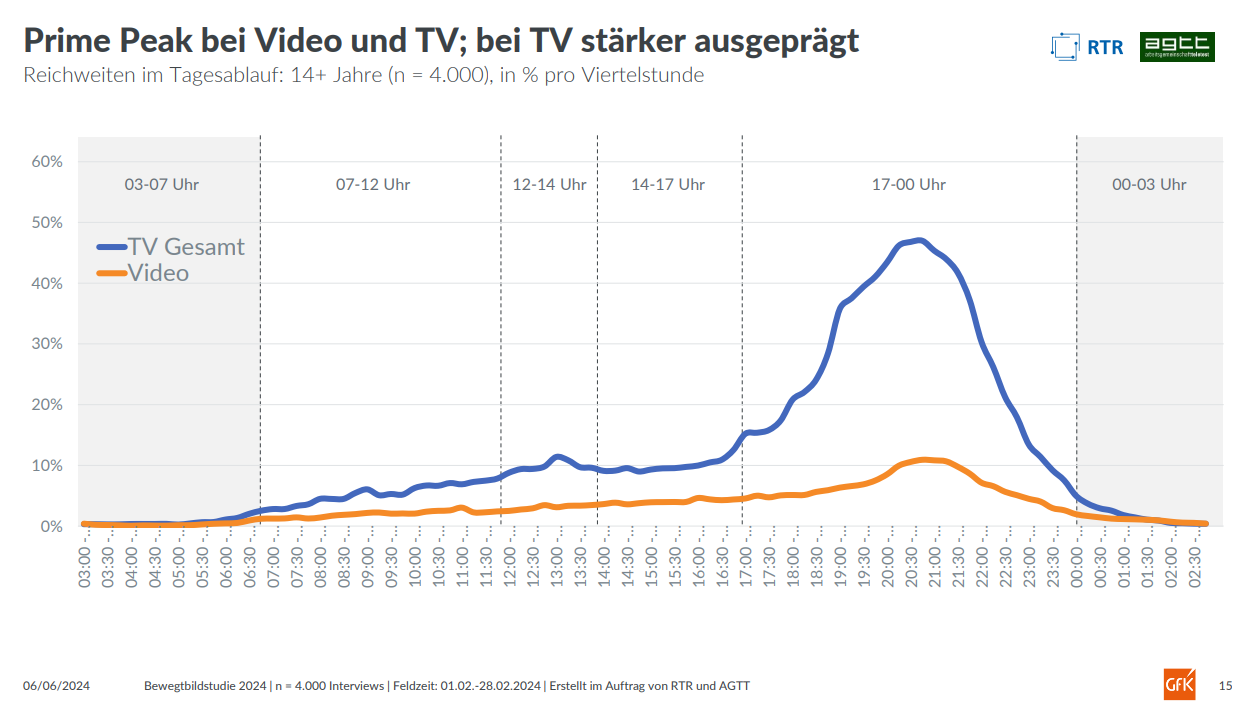
Consumption of broadcaster content reaches an absolute peak between 5 pm and midnight. From 6 pm onwards, reach increases exponentially, achieving 47% between 8:45 pm and 9 pm. The usage curve flattens again in the late evening. The use of online video services follows a similar pattern but does not have such a pronounced peak in the evening.
Highest daily range for transmitters
For the total population, broadcasters achieve a daily reach of 72%, well ahead of all video services. Only YouTube reaches double digits with 10%. Other providers and platforms are not experiencing growth in the current highly fragmented market and remain in single digits. In terms of social media, Instagram leads with 5%, followed by WhatsApp, TikTok and Facebook.
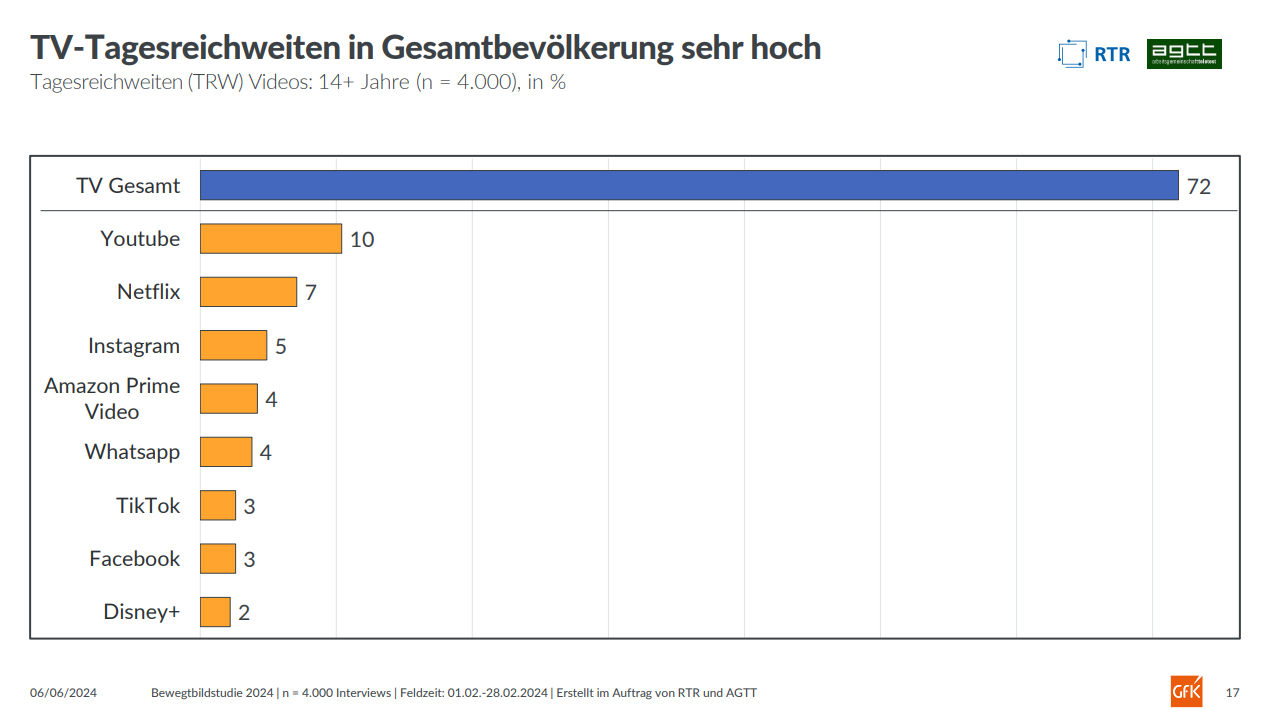
Among users aged 14-49, broadcasters have a daily reach of 59%, while YouTube is in second place with 16% and Netflix in third place with 11%. Other video and social media providers only have single-digit reach.
Big screen for broadcaster content
For viewing broadcasters’ content, the classic TV screen is the most popular among the general population. Scientific studies show that advertising has the greatest impact, and content is given the highest attention. 94% of TV content is watched on the big screen. When it comes to broadcast content, the big screen clearly leads with 89%, ahead of video (10%) and DVDs (1%). Video consumption is more varied: the TV screen accounts for 36%, a computer or laptop 30%, a smartphone 24% and a tablet 7%.
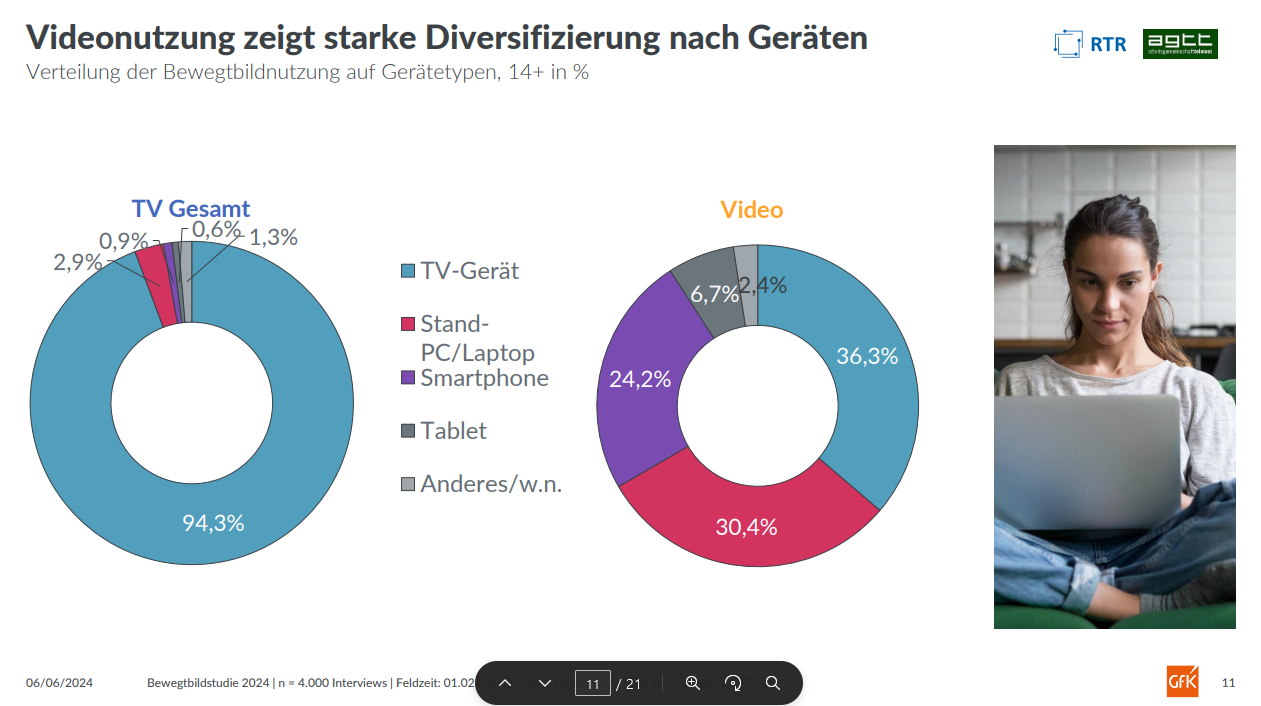
Younger viewers watch 78% of broadcasters’ content (live or time-shifted viewing) on the big screen, followed by videos (19%) and DVDs (3%). Video viewing is almost evenly distributed between TV (33%), PC or laptop (32%) and smartphone (28%).
How the study was conducted
As part of the ninth edition of the moving image study, GfK conducted a survey of 4,000 people over the age of 14 living in Austria, representative of the general population. The survey was conducted by computer-assisted web interview (CAWI) between 1 February and 28 February 2024.
The 2024 Moving Image Study by RTR Medien and the TELETEST working group is now available with detailed charts and tables on the Screenforce website at screenforce.at and in full on the RTR website at rtr.at.
Download
Moving Image Study 2024 (2 572 kB)
Images and charts can be downloaded here.
Source: screenforce.at

