At a high level, TV households can access TV content in one of three ways:
- Cable/Direct broadcast satellite
- Broadband internet
- Over-the-air (OTA) antenna
These access points are not mutually exclusive. A home can have TV sets that access content in different ways. Many homes, for example, access content through cable boxes and complement that content with streaming video. The same is true of homes that access free OTA programming; 60% of OTA households also subscribe to a streaming video service.
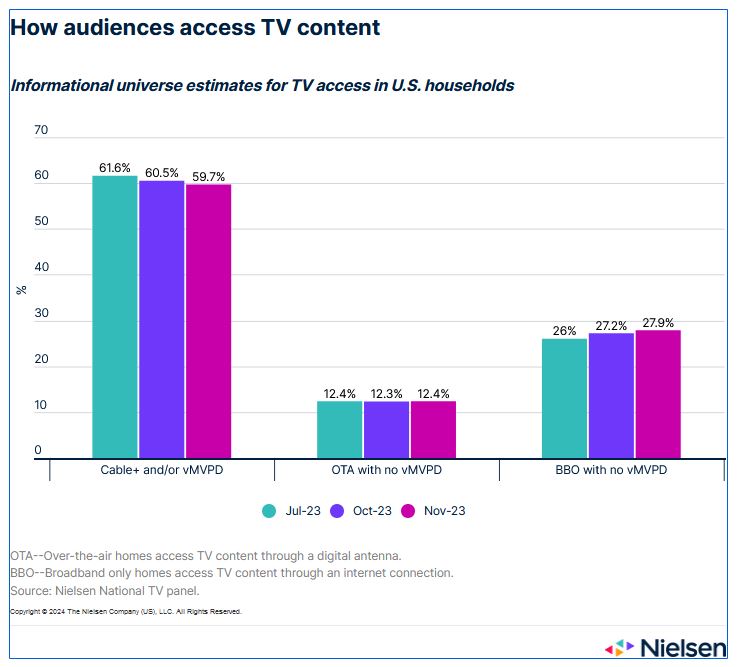
To help clients better understand the fragmentation of TV content access types, Nielsen has prepared a set of informational universe estimates that break down the U.S. TV universe by access type.

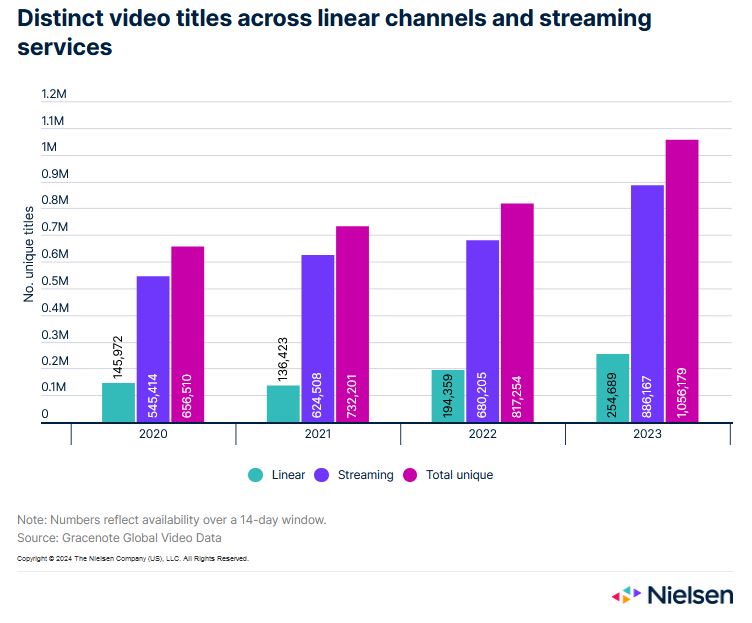
Given the variety of options, the topic of content access has become increasingly important, particularly with respect to measuring connected TV (CTV)1 usage. CTV usage, which allows audiences to access anything the internet has to offer, had grown to account for more than 38% of total TV usage among adults as of second-quarter 2023. The reason? Choice. According to Gracenote Global Video Data, 84% of the studio-produced video titles available to U.S. audiences are available on streaming platforms.

The recent ramp-up in CTV adoption has significantly amplified streaming usage over the last year: Streaming has accounted for more than one-third of total TV usage in the U.S. since February 2023, and has accounted for more than 36% since May2. During the week of Nov. 6, 2023, for example, TV audiences watched more than 15.6 billion hours of the top 10 most-streamed original programs, movies and acquired programs available to them3.
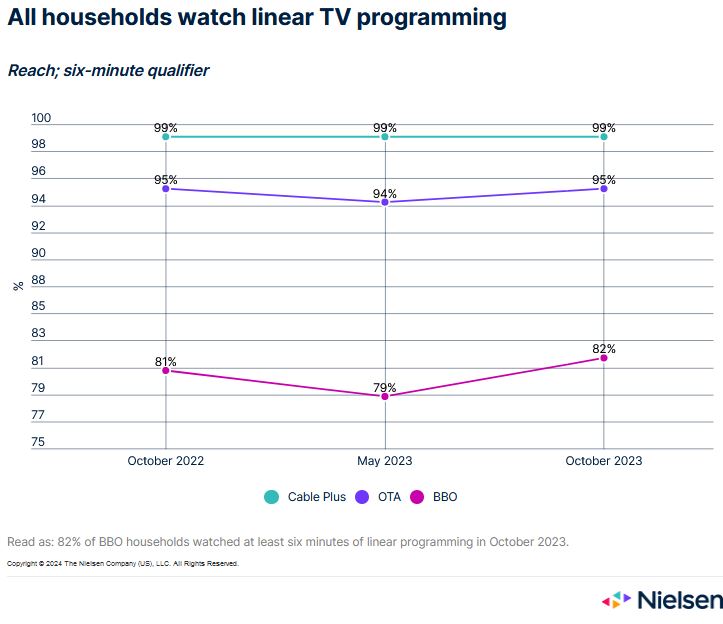
While widespread CTV adoption signals a new era in how audiences access content, it has created a misconception that viewers no longer watch linear programming. Importantly, the reality is quite the opposite. In fact, regardless of how a home accesses TV content, more than 90% watch some amount of linear programming.
The variety of content available outside of traditional cable packages is undeniable, and audiences are actively using TV connected devices and smart TVs to access it. Yet while the percentage of homes that access TV content through a broadband internet connection had risen to just under 40%4 in September of 2023, CTV access does not mean audiences are only watching on-demand content. In fact, 82% of BBO only households were watching linear programming in October, which is up 3 percentage points from earlier in the year.

Given that none of the ways in which audiences access TV are mutually exclusive, consensus about TV home classification has become complicated, especially with regard to homes that now access content with an internet connection. Much of that complication, however, is related to the range of acronyms and terms that have been coined to describe the technology associated with content access. These acronyms and terms of art overcomplicate the premise of audience measurement, especially with regard to CTV usage.
Through the lens of total TV usage, regardless of access point, the keys to media planning only involve answering two questions:
- Who’s watching
What they’re watching
The shift in how connectivity is reshaping content access is undeniable, but advertisers and agencies can take comfort in knowing that the measurement data that they rely on—agnostic of content source—is accurate and representative of the comprehensive TV viewing audience. And given the complexities of today’s media landscape, Nielsen remains committed to working with the industry to better define its nuances.
Sources
1 CTV refers to any television that is connected to the internet. The most common use case is to stream video content
2 The Gauge
3 Nielsen’s weekly Top 10 lists
4 This figure includes homes that access programming through a vMVPD. Later this year, homes that access programming from a vMVPD will be classified as cable homes.
Source: nielsen.com

