
You can download the study for free here.
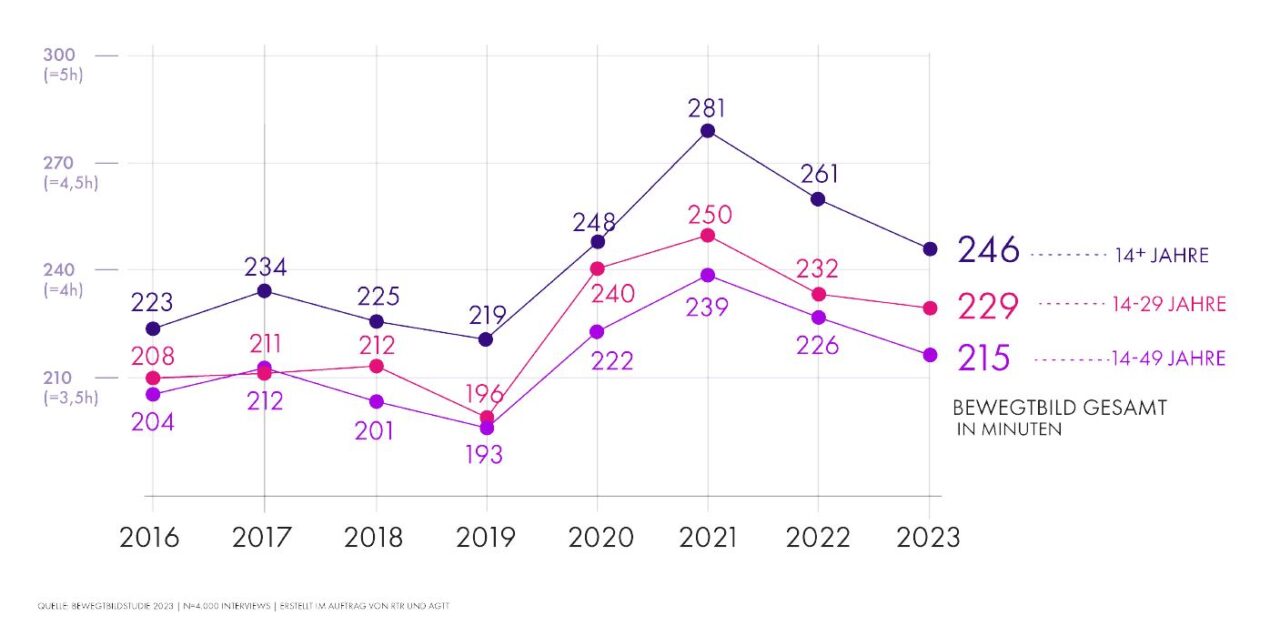
According to the “Moving Image Study 2023”, the use of moving image in Austria is consistently high across the population (246 minutes per day) and higher than in the pre-pandemic era. In 2019, viewers watched 219 minutes of video content per day. Individuals aged 14-49 spend 215 minutes per day watching video content (226 minutes in 2022 and 193 minutes in 2019 before the coronavirus outbreak). There was almost no shift from the previous year in the group of young active people aged 14-29 years who spend 229 minutes per day consuming video content (232 minutes in 2022; 196 minutes in 2019).
Chart: Average use time per person
 Source: rtr.at
These are the conclusions of the “Moving Image Study 2023” presented by Wolfgang Struber, Head of the Media Division of Rundfunk und Telekom Regulierungs-GmbH (RTR Medien), Thomas Gruber, Chairman of TELETEST (AGTT), and Susanne Reichl, Head of Media Measurement at GfK Austria.
“In the first year after the coronavirus pandemic, the use of moving image has seen a decline compared to record levels during the pandemic, a phenomenon that can be observed globally. However, the figures are noticeably higher than before the coronavirus,” says Wolfgang Struber, CEO of RTR Medien. “Across the various moving image sources - from television to various video platforms to DVDs - the dynamics have slowed down after the coronavirus and the shares of the various sources seem to have levelled off. The use of television offerings, whether through linear broadcasting, radio or online, remains high and accounts for approximately three quarters of the use of moving image in the total population. The use of alternative video platforms accounts for just over 20 per cent. Very young people aged 14-29 already use nearly 65 percent of video content online, with TV content and alternatives used in roughly equal proportions,” Struber continues.
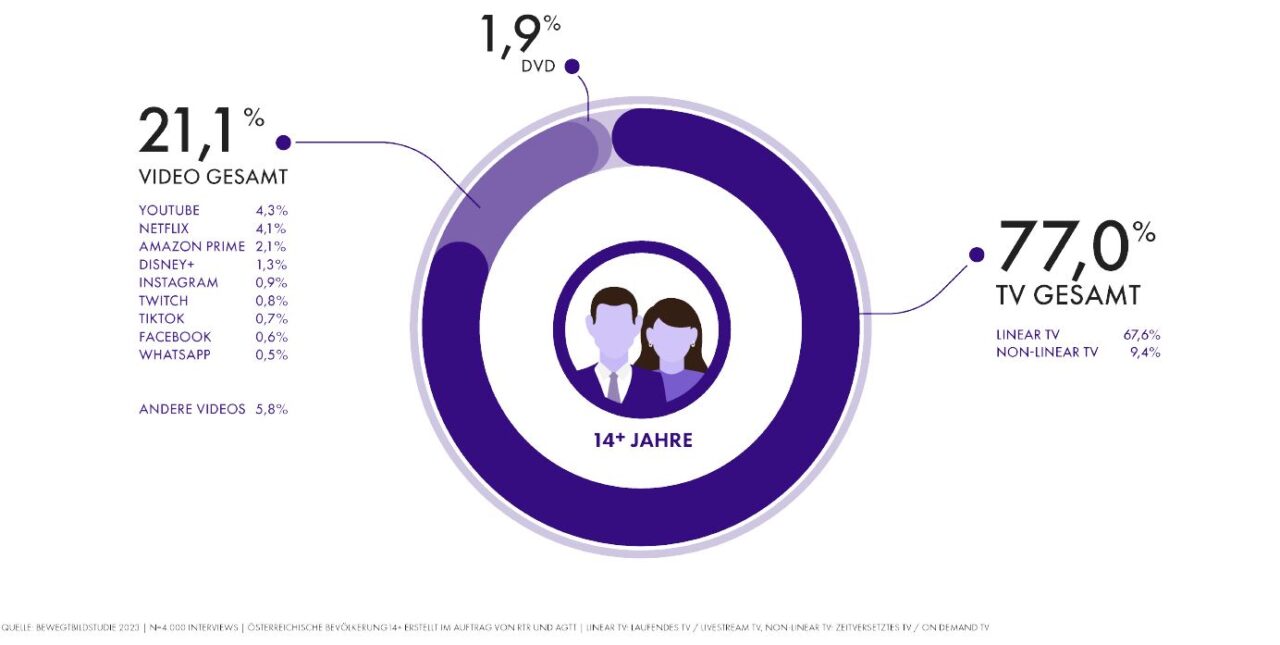
99% of Austrians use the moving image offer at least once a week. The broadcasters’ offerings on all transmission channels (live TV, catch-up TV, live streaming and on-demand TV) account for 77 per cent of the usage time in the total population.
Chart: Using the moving image offering
 Source: rtr.at
“The ever-increasing availability of broadcasters’ content - including through various online and aggregation platforms - is reflected in the consistently very high consumption of TV content across all distribution channels. Television is the main medium among all content delivered via the moving image. Broadcast content is the most used video content on all screens across all age groups,” emphasises Thomas Gruber, Chairman of TELETEST.
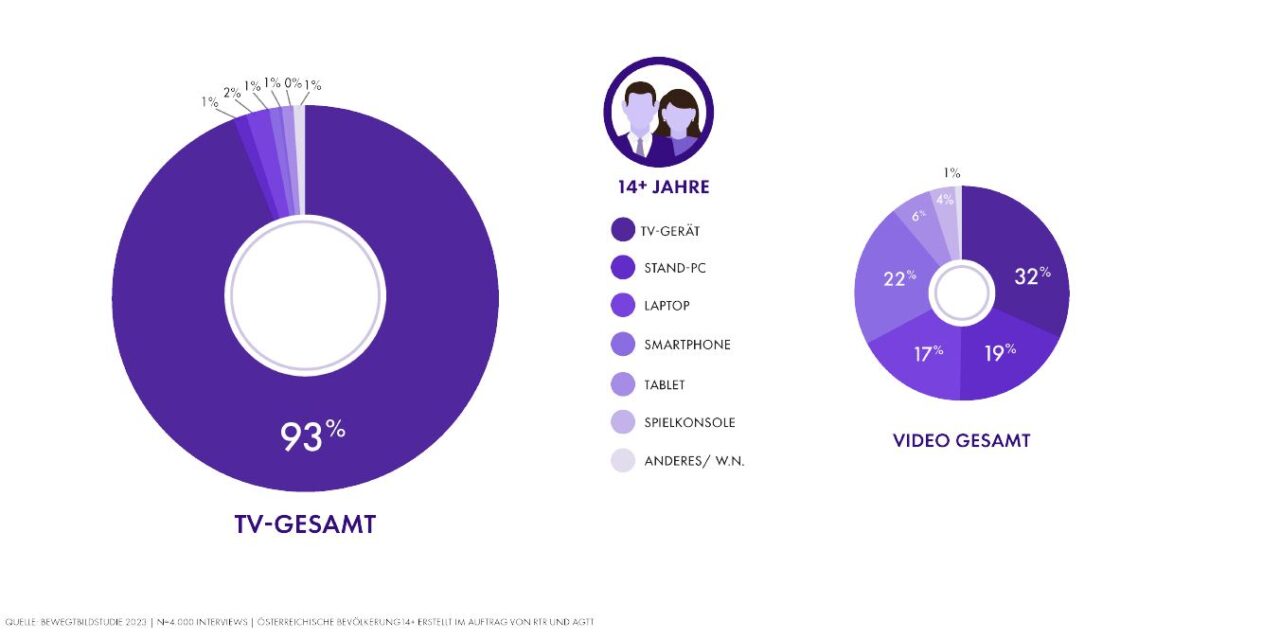
The big screen is the first choice for video consumption
A closer look at what is being watched on which device shows that 93% of TV content is consumed on the big screen. Videos are also watched on the big screen less than a third of the time. Other popular devices for consuming video platforms such as YouTube or Netflix are smartphones (22%), laptops (19%), and desktops (17%). The 14-49 age group shows similar results: 86% of respondents also use the big screen to consume TV content. Laptops (4%), desktops (3%) and smartphones (2%) play only a minor role. The big screen (28%) is also the top choice for video consumption by 14-49 year olds. This is followed by the smartphone (24%), desktop (19%) and laptop (17%).
Chart: Using moving image on different types of devices
 Source: rtr.at
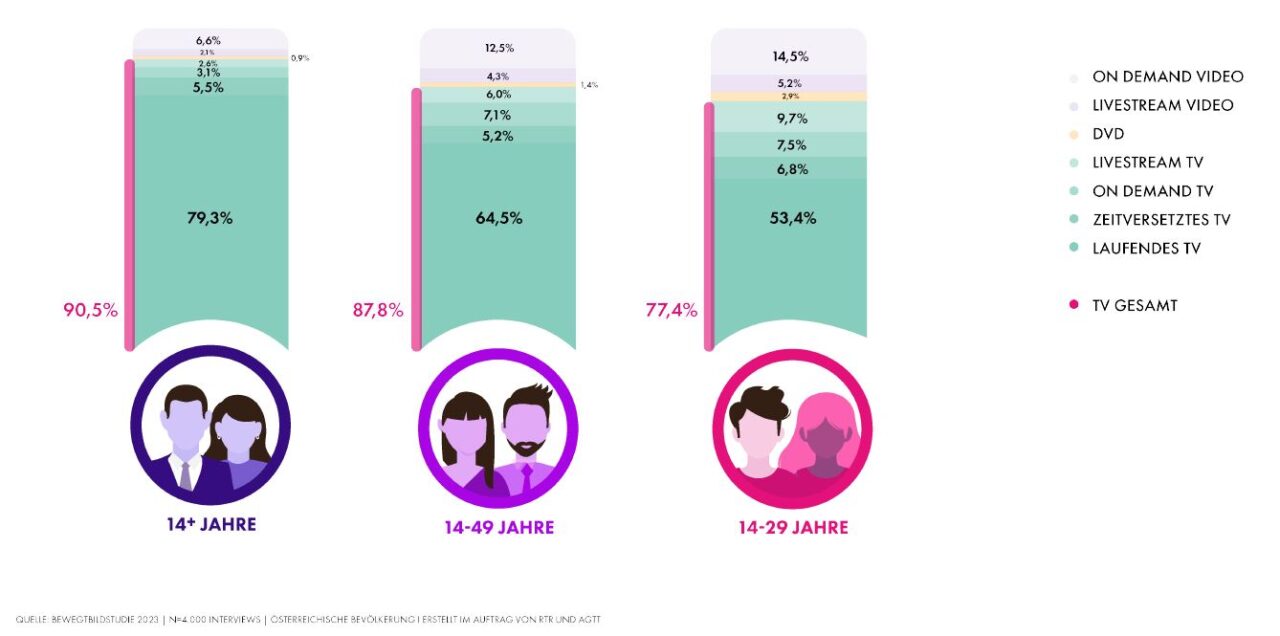
Live TV accounts for eight out of ten minutes of big screen use
Across the population, live TV accounts for 79% of the time spent on the big screen where advertising has the greatest impact as numerous studies show. A further 6% is accounted for by time-shifted broadcasts and 6% by content libraries, meaning that TV accounts for 91% of big screen time. Video-on-demand and live streaming account for just under 9%.
Chart: Distribution of moving image usage on the big screen
 Source: rtr.at
Broadcasters’ offerings account for three quarters of the population’s use of moving image
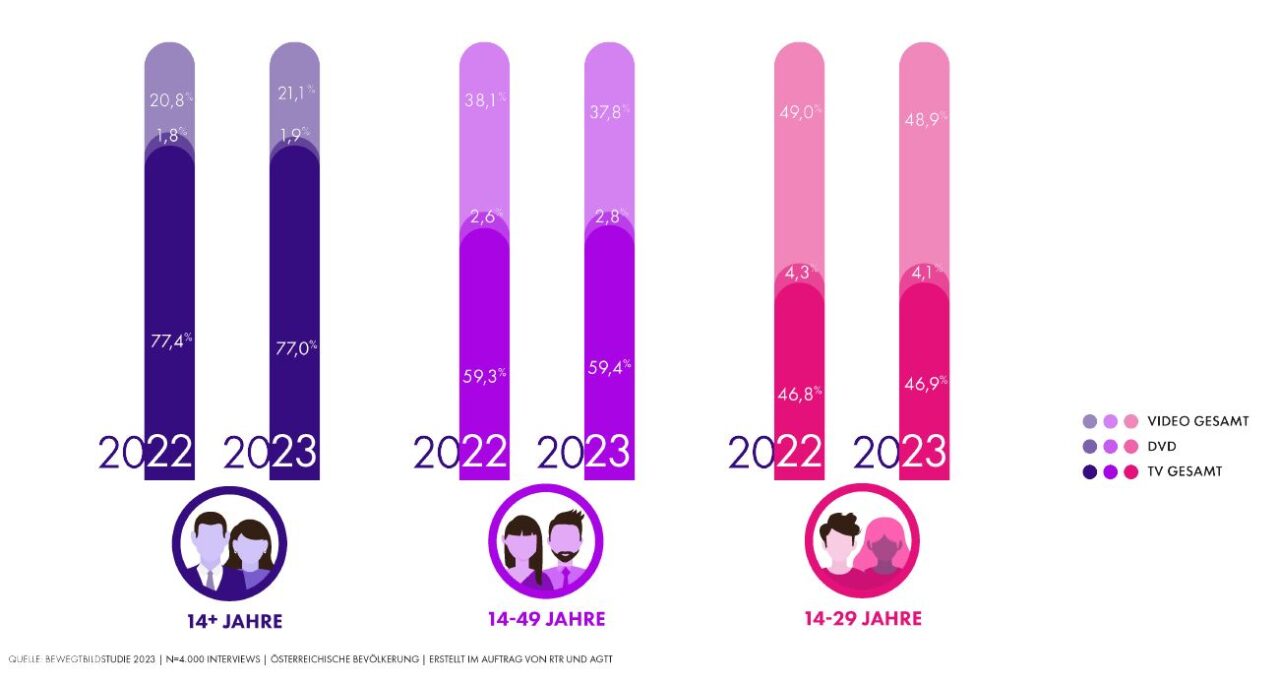
There has been virtually no shift in the behaviour of the overall population when using the moving image compared to last year: broadcasters’ offerings account for 77% of usage (live TV, catch-up TV, live streaming and on-demand TV). Video platforms account for 21% (comprehensively), with YouTube and Netflix accounting for around 4% and Prime Video around 2%. Disney+ accounts for just over one per cent and other sources less than one per cent. For 14-49 year olds, broadcasters’ offerings account for 60% of moving image usage in all forms; for 14-29 year olds, it is 47%. Video platforms account for 38% of the 14-49 age group and approximately 49% of the very young target group.
Chart: Comparison of moving image shares in 2022 and 2023
 Source: rtr.at
Daily reach: streaming services showing a slight decline
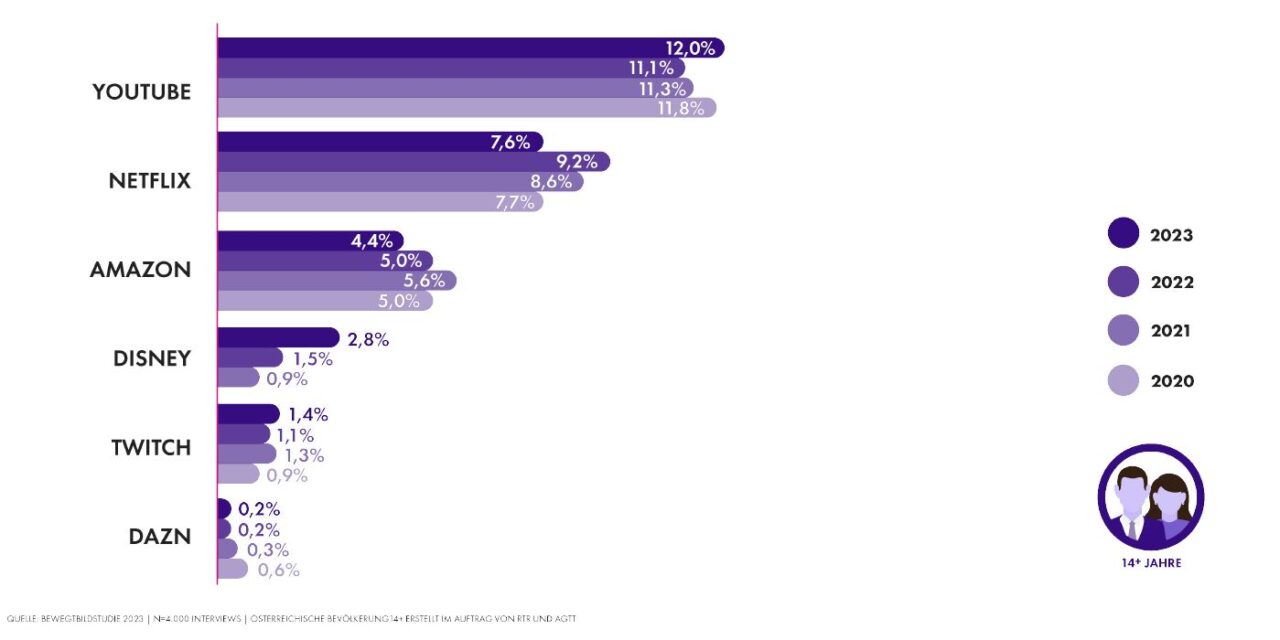
In the total population, TV daily reach is 74%. Video platforms together account for an average of 31% per day: 12% YouTube, 8% Netflix, 4% Prime Video and 3% Disney+.
Video daily reach on video portals
 Source: rtr.at
“The streaming services market is increasingly competitive due to the growing number of providers. While broadcasters are seeing stable usage shares, some streaming services are seeing a slight decline in favour of new offerings. Streaming service providers are directly competing for limited budgets and viewers’ time,” explains Gruber.
How the study was conducted
As part of the eighth edition of the Moving Image study, GfK conducted a survey of 4,000 people over the age of 14 living in Austria, representative of the general population. The survey was conducted by computer-assisted web interview (CAWI) between 1 February and 28 February 2023.
The Moving Image 2023 study by RTR Medien and TELETEST is now available with detailed charts and tables on the Screenforce website at screenforce.at and in full version on the RTR website at rtr.at.
For downloading: Bewegtbildstudie 2023 (4635kB)
Source: screenforce.at