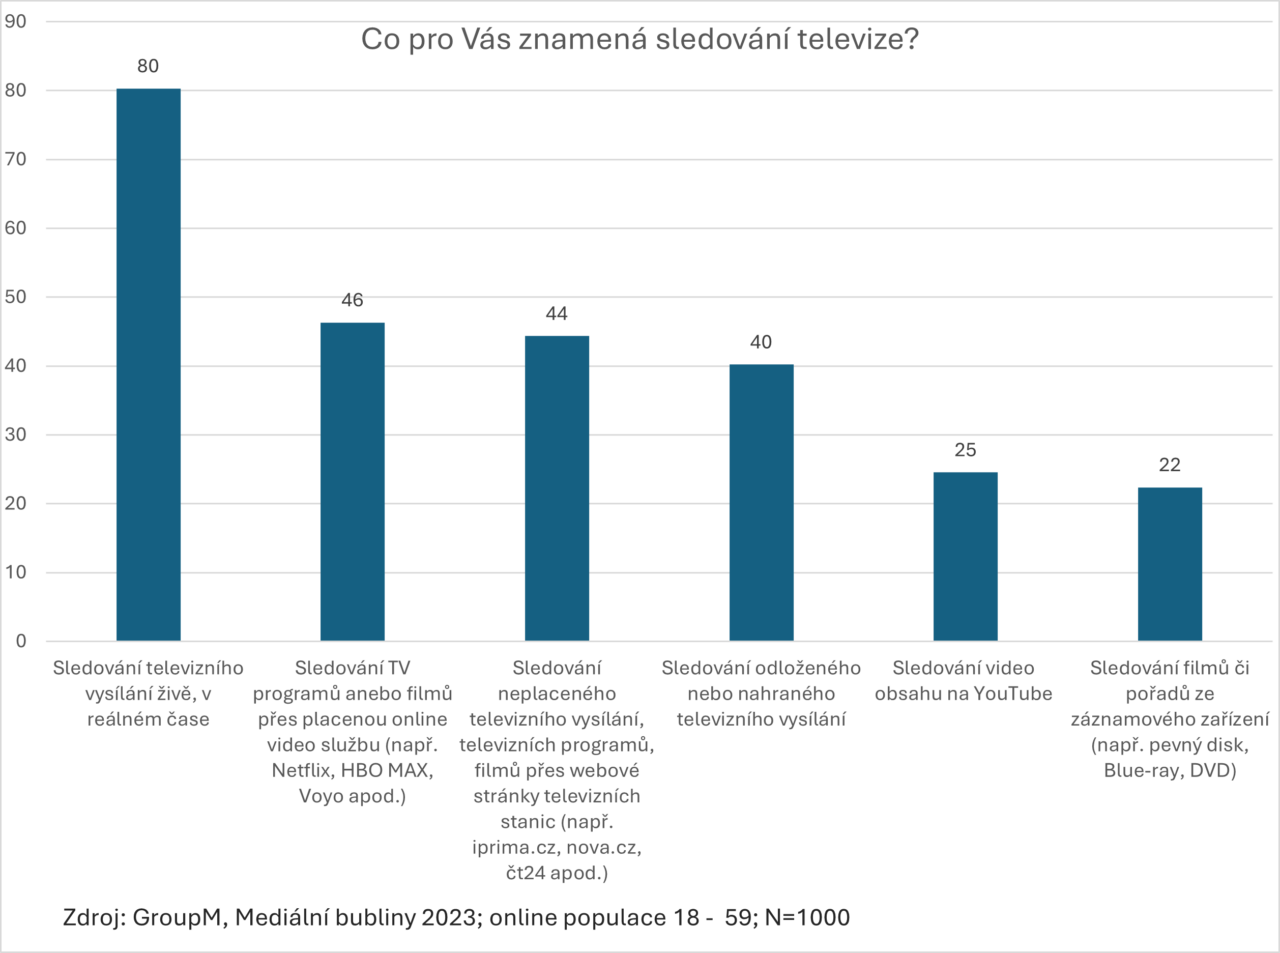
Research Media Bubbles carried out in 2023 shows that for 80% of the online population, watching TV still means watching live TV. This group is also increasingly watching subscription and non-subscription video services (VOD) on TV. Shows from a recording device, hard drive, or a DVD are watched much less. However, with 22%, this category is not insignificant either.
What does watching TV mean to you?
 Source: GroupM
Thanks to mPanel, our continuous research on media behaviour, we can also take a closer look at who TV viewers are, whether they watch live or time-shifted broadcasts or programmes on different VOD platforms.
For all these media types, we defined heavy, medium, and light viewers. To avoid everyone having a different idea of TV viewing, we also distinguished between live and time-shifted TV and separately surveyed VOD consumption regardless of device.
Who are the most loyal of loyal TV viewers
Who are the heavy TV viewers, whether it is live TV or time-shifted viewing, i.e. those who say they spend more than 3 hours a day in front of the TV? There are 1.5 million of them in the online population, and they are both men and women, more often pensioners (31%) or people with adult children who are still studying (18%), and empty-nesters (14%). They are more often from urban areas (69%).
They watch most video content on their TV screens. 18% of them are also heavy VOD consumers (later in the article, we describe what additional activities this particular group has time for).
In contrast, more than half of them (52%) don’t watch VOD at all, 62% don’t listen to podcasts, and 47% don’t use any music streaming platforms. This is related to the older age of this group.
They are also active on social media, 62% are daily on Facebook, 23% on YouTube, and 21% on Instagram.
You can reach them with a leaflet campaign, 47% see leaflets distributed to their mailboxes regularly.
In contrast, young parents (24%) and students, people aged 15-44 (63%), are more likely to be light TV viewers (19%). These are most often people from higher socio-economic groups.
They are more likely to be influenced by recommendations from influencers, celebrities, and famous personalities than by advertising. 34% are influenced by online comments and reviews.
You reach them on FB (50%); 37% follow IG, 36% YT, and 13% can be addressed on TikTok.
When they happen to watch TV, 54% watch it live only, with no time shift. 42% don’t watch VOD at all. They prefer watching videos on social media.
38% spend up to 1.5 hours a day listening to music streaming platforms and 35% of light TV viewers spend the same amount of time with podcasts. Only 26% pay to consume ad-free content on Spotify.
What audiences are attracted by video services
In the online population, there are less than 850,000 heavy users of VOD platforms, i.e. those who spend more than 2 hours a day watching videos and VOD programmes. There are slightly more females (52%) in this group and again, they are most often between 15 and 44 years old, young parents (28%), or students and non-students (14%). 45% of them enjoy shopping of any kind and 35% of them often buy an item without needing it.
They spend a lot of time on social media, with 58% feeling the need to check it daily. 67% of them can be found daily on Facebook, 48% on Instagram, 41% on YouTube, and 21% on TikTok. VOD platforms are typically watched on TV (68%) and a computer (37%). 15% of them are heavy TV viewers. 68% of them listen to music streams for at least 15 minutes a day, typically on unpaid YouTube (86%) or unpaid Spotify (45%) – so they don’t mind ads. Only 35% of them pay for Spotify.
In the online population, there are 833,000 light VOD users, i.e. those who watch no more than 40 minutes a day. There are slightly more males in the group (52%), 84% are aged 15-54, young or mature parents account for 25% and 21%, respectively, and students account for 16%. They exercise at least once a week and like to travel and discover new places (33%).
52% of them can be found daily on Facebook, 35% on Instagram and 33% on YouTube. 50% of them are light TV viewers. They watch VOD most often on TV (40%) and a computer (23%). 63% listen to music for up to 90 minutes a day, typically on unpaid YouTube (83%) or Spotify (38%). And 49% listen to podcasts for up to 45 minutes a day. Only 28% pay for Spotify.
We were interested in the group of people who declared that they watch TV more than 3 hours a day plus VOD more than 2 hours a day. I was wondering what else they do if anything. There are 275,000 heavy users of TV and VOD at the same time in the online population, with the most common age groups being 25-54 (69%), equally female and male, young (29%), and mature (19%) parents. Unsurprisingly, they are most likely to spend their free time with their families (78%) and 51% would like to have adventures in their free time. 36% like novelty and changes in their lives. Surely, family life has plenty of them on offer.
58% of them feel the need to check social media daily, which is why you find them on Facebook (74%), Instagram (37%), YouTube (36%) or TikTok (14%) every day.
They mostly watch TV and VOD on TV (79% and 75%, respectively). In addition, they listen to music for at least 15 minutes a day (63%), especially on unpaid YouTube (86%) and Spotify (41%). They don’t mind advertising; on the contrary, it helps them choose goods and services (25%). Only 28% of them pay for Spotify.
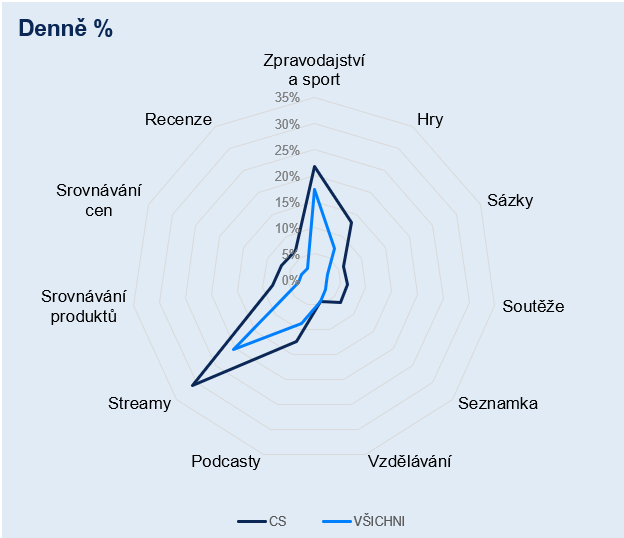
We were interested in the specific activities that heavy TV and VOD users engage in, and how, if at all, their activities differ from the online population. They daily engage in almost everything more than the online population, they just don’t have time for dating sites.
 Source: mPanel, GroupM, CS: TV Heavy Users + VOD Heavy Users, TG size: 274 583
On that occasion, we also looked at the other extreme that is not very interesting for marketing, specifically those who do not watch TV or VOD. There are 750,000 of them in the online population, the share of women is slightly higher (55%) but otherwise, they are evenly spread across age groups at around 20% each.
Since they don’t spend time in front of the TV, they have plenty of time (42%) and prefer to spend it in the country (58%). When buying goods, they don’t care about the brand, but the utility value is important (64%). 84% try to avoid debt and like to travel independently (45%).
In addition to not watching TV or VOD, they don’t spend much time on other media types either. They use social networks like the average population. They don’t listen to radio or online music (53%), nor do they listen to podcasts (68%). To put it simply… they are not an interesting group for marketing.
All of the above groups look for information about products/services on the internet when watching TV. They often inquire about those items they have seen on the air. Quite unsurprisingly, this group includes the most loyal of the loyal, i.e. heavy TV and heavy VOD viewers, accounting for 28%; the group that does not use any VOD services is the least likely to search the internet when watching TV.
As we found out from the comparison of the declared mPanel data and the real data from the peoplemeters, where the difference in favour of the peoplemeters was noticeable, people underestimate themselves regarding the consumption of different media types. Based on this, we dare say that our ideas about how we consume different media types are quite underestimated.

